728x90
1. 정밀도 (Precision)
예측 Positive 중 올바르게 Positive를 찾아낸 비율
2. 재현율 (Sensitivity, 민감도) = recall
실제 positive 중 올바르게 Positive를 찾아낸 비율
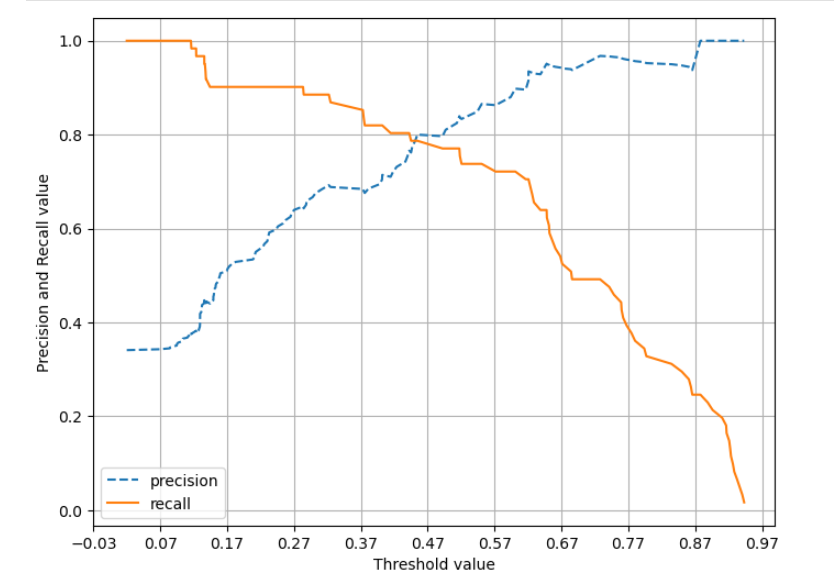
3. 정밀도와 재현율의 트레이드오프
- 분류하려는 업무 특성상 정밀도 또는 재현율이 특별히 강조되어야 할 경우, 분류의 결정 임계값(Threshold)을 조정해 정밀도 또는 재현율의 수치를 높일 수 있음
- 정밀도와 재현율은 상호 보완적인 지표임
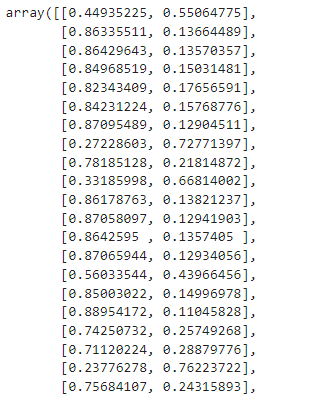
predict_proba()
[클래스 0일 확률, 클래스 1일 확률]을 반환
titanic_df = pd.read_csv('./titanic_train.csv')
y_titanic_df = titanic_df['Survived']
X_titanic_df= titanic_df.drop('Survived', axis=1)
X_titanic_df = transform_features(X_titanic_df)

X_train, X_test, y_train, y_test = train_test_split(X_titanic_df, y_titanic_df, \
                                                    test_size=0.20, random_state=11)

lr_clf = LogisticRegression(solver='liblinear')

lr_clf.fit(X_train , y_train)
pred_proba = lr_clf.predict_proba(X_test)
pred_proba
Binarizer()
기준값 미만은 0, 기준값 이상은 1로 반환
from sklearn.preprocessing import Binarizer

X = [[ 1, -1,  2],
     [ 2,  0,  0],
     [ 0,  1.1, 1.2]]

# threshold 기준값보다 같거나 작으면 0을, 크면 1을 반환
binarizer = Binarizer(threshold=1.1)
binarizer_fit = binarizer.fit(X)
predict = binarizer_fit.transform(X)
print(predict)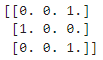
결정 임계값에 따른 정밀도와 재현율의 변화
# 테스트를 수행할 모든 임곗값을 리스트 객체로 저장.
thresholds = [0.4, 0.45, 0.50, 0.55, 0.60]

def get_eval_by_threshold(y_test , pred_proba_c1, thresholds):
    # thresholds list객체내의 값을 차례로 iteration하면서 Evaluation 수행.
    for custom_threshold in thresholds:
        binarizer = Binarizer(threshold=custom_threshold).fit(pred_proba_c1)
        custom_predict = binarizer.transform(pred_proba_c1)
        print('임곗값:',custom_threshold)
        get_clf_eval(y_test , custom_predict)

get_eval_by_threshold(y_test ,pred_proba[:,1].reshape(-1,1), thresholds )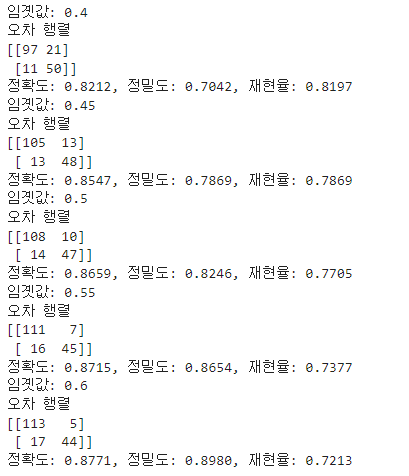
precision_recall_curve()
precision_recall_curve(실제값 데이터 셋, 레이블 값이 1일 때의 예측 확률)
정밀도, 재현율, 임계값을 반환
from sklearn.metrics import precision_recall_curve

# 레이블 값이 1일때의 예측 확률을 추출
pred_proba_class1 = lr_clf.predict_proba(X_test)[:, 1]

# 실제값 데이터 셋과 레이블 값이 1일 때의 예측 확률을 precision_recall_curve 인자로 입력
precisions, recalls, thresholds = precision_recall_curve(y_test, pred_proba_class1 )
print('반환된 분류 결정 임곗값 배열의 Shape:', thresholds.shape)
print('반환된 precisions 배열의 Shape:', precisions.shape)
print('반환된 recalls 배열의 Shape:', recalls.shape)

print('thresholds 5 sample:', thresholds[:5])
print('precisions 5 sample:', precisions[:5])
print('recalls 5 sample:', recalls[:5])

#반환된 임계값 배열 로우가 147건이므로 샘플로 10건만 추출하되, 임곗값을 15 Step으로 추출.
thr_index = np.arange(0, thresholds.shape[0], 15)
print('샘플 추출을 위한 임계값 배열의 index 10개:', thr_index)
print('샘플용 10개의 임곗값: ', np.round(thresholds[thr_index], 2))

# 15 step 단위로 추출된 임계값에 따른 정밀도와 재현율 값
print('샘플 임계값별 정밀도: ', np.round(precisions[thr_index], 3))
print('샘플 임계값별 재현율: ', np.round(recalls[thr_index], 3))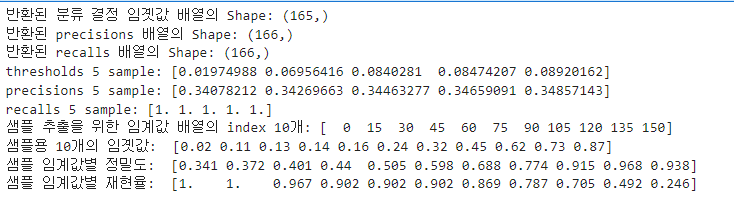
728x90
'머신러닝' 카테고리의 다른 글
| [분류] 결정트리 파라미터 DecisionTree parameters (0) | 2024.03.03 |
|---|---|
| anaconda Graphviz 설치 방법 (0) | 2024.03.03 |
| 데이터 전처리(Preprocessing) (0) | 2024.03.02 |
| [머신러닝] 분류분석 평가 지표 - 오차행렬, ROC (0) | 2024.02.20 |
| [머신러닝] 피처스케일링 - StandardScaler, MinMaxScaler (0) | 2024.02.19 |